Review : Advancing NGS quality control to enable measurement of actionable mutations in circulating tumor DNA

The aims of this study included the following. First, design methods for incorporation of synthetic human genome reference sequence internal standard spike-ins into hybrid-capture targeted-NGS UMI library analysis. Second, validate these methods as orthogonal QC in SEQC2 Sample A in non-UMI libraries following Roche SeqCap EZ Choice custom PHC panel enrichment, positional deduplication, and Poisson Exact Test (PET) analysis of NT variant reads relative to IS variant reads. Third, evaluate clinical utility of this method in SEQC2 contrived ctDNA Samples DfIS and EfIS following Illumina TST170 hybrid capture panel enrichment, UMI deduplication, and PET analysis of NT variant and IS variant reads.
They used Internal standard (IS) to their method to improve the accuracy of variant calling and the generation of VCF files with VarDict. The IS consisted of synthetic DNA oligos that were spiked into the sample at known concentrations before library regions of the genome and preparation. IS includes unique dinucleotides (DN) every 40–60 bp to allow for bioinformatic separation of IS from native template (NT) genomic reads.
Experiment & Result
Ground truth variant dataset was identified for SEQC2-contrived tumor reference Sample A (a pool of ten diverse cancer cell lines) in a related SEQC2 project study (Deveson, 2021; Jones et al., 2021). For this purpose, the Roche SeqCap EZ Choice custom PHC panel was used for hybrid capture enrichment followed by non-UMI library preparation. A 7.5 kb region common to the SNAQ-SEQ IS mixture and the Roche SeqCap EZ Choice custom PHC panel also spanned the 6.8 kb Illumina TST170 SNAQ-SEQ IS consensus region.

Graph 1B is an example of coverage covariation for IS and NT DNA fragments during enrichment, the IS and NT sequences mapped to EGFR gene are presented in Figure 1B. The histogram demonstrates that, the IS and NT were captured proportionately across all probes in the EGFR panel with peak capture efficiency in exonic regions.
Colored columns indicate bases alternate (alt) to hg19 reference with >5% VAF. IS alts were engineered dinucleotides; NT alts were SNPs derived from one or more cancer cell lines in Sample A.
Figure 2. shows the identification of Sample A ground truth TP variants. Ground truth TP variants were identified within the consensus region for the Roche SeqCap EZ Choice custom PHC, panel TST170 panel, and SNAQ-SEQ IS panel, based on serial dilution of Sample A with Sample B from 2- to 64-fold (AB2 through AB64),Plotted are the average replicate VAF values for 19 variants that demonstrated a dilution response, with information for each variant in the legend. One additional Sample A TP variant restricted to the consensus region between TST170 and SNAQ-SEQ IS (i.e., not in Roche panel) was identified through serial dilution, resulting in a total of 20 ground truth TP variants.

In Fig 1C, The 5,608 Sample A NT alts with matched alts in the IS sequence were plotted: NT VAF (y axis) and IS VAF (x axis). NT alts called by VarDict are indicated as significant (green filled) or not significant (red filled) by SNAQ-SEQ QC PET analysis, and alts that were not called by VarDict or SNAQ-SEQ QC PET analysis are indicated as gray circles. Frequencies of the 374 VarDict PASS NT alts, binned according to PET score, are presented in Figure 1D.
PET was used to analyze the relative VAF values for each NT alt and corresponding IS alt to establish LOB and LOD for measurement of the NT alt.
In Fig.1D Alts with PET score significantly different from NGS background error ap
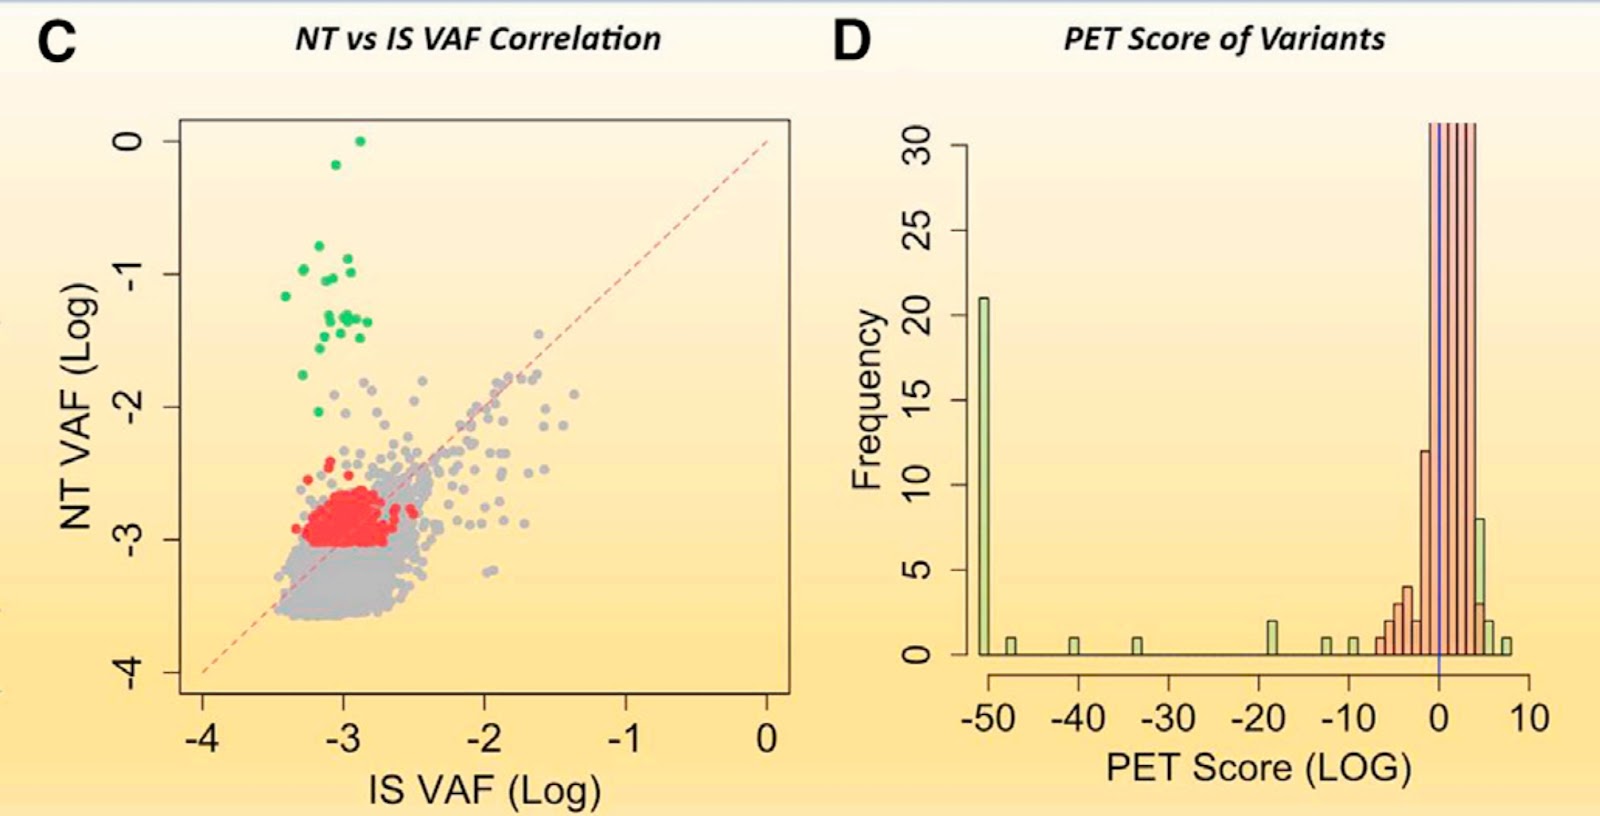
Therefore, the highest PET score observed for an IS technical error variant was used to determine PET score significance threshold for NT variants.
The 28 ground truth TP variants were called by VarDict, confirmed by SNAQ-SEQ QC with PET analysis (green columns with negative PET score),
To evaluate the utility of SNAQ-SEQ QC to improve NGS analysis of ctDNA samples, we used the Illumina TST170 enrichment platform, followed by Illumina UMI library preparation and variant calling. This UMI dataset represented one of the best commercially available error-corrected NGS methods and therefore was a suitable challenge for SNAQ-SEQ to demonstrate additional QC utility.
Sample A was a mixture of ten cancer cell lines. Samples D and E were created through 5- or 25-fold dilution of Sample A DNA with normal cell line Sample B DNA. Therefore, the set of variants comprised of Samples D and E represent the intersection of Samples A and B but at different variant allele frequencies SEQC2 Samples B, D, and E were subjected to enzymatic fragmentation followed by size selection to create Samples Bf, Df, and Ef that were each mixed with fragmented IS spike-in mixture to make Samples BfIS, DfIS, and EfIS, respectively.
Based on the ground truth data, the expected VAF range in Sample A for the 20 TP variants covered by the TST170/SNAQ-SEQ IS overlap was 2.5%–5%, 0.5%–1% for Sample DfIS and 0.1%–0.5% for Sample EfIS which would challenge the detection limit. the SNAQ-SEQ IS mixture was mixed with Samples DfIS and EfIS to achieve at least a 2.5:1 IS:NT depth ratio. Assuming no variant was detected in IS, a variant with three NT alts would have a significant PET value when the IS depth was 2.5-fold more than NT.
Figure 3A depicts graphs that present the distribution of PET scores for each variant in each replicate library of Samples DfIS and EfIS.

As is evident, in Sample DfIS (upper panel) the PET scores corresponding to the TP variants were highly significant (green bars) and well separated from the background alts. Importantly, due to effective UMI suppression of technical error, no PET significant IS variants were observed in any of the Sample DfIS or EfIS replicate libraries, in contrast to the presence of PET significant IS variants in the non-UMI Sample A libraries an alternative view of the difference between TP and NGS sequencing error is depicted in the bivariate plots, Figures 3B and 3C. In Figure 3B, the VAF for each NT alt (y axis) with a matching IS alt (x axis) was presented. For Sample DfIS, there were two well-separated clusters. On the one hand, the VAF for each TP variant was two to three logs higher than for the matching IS alt (green-filled circles). In contrast, the cluster associated with the 1:1 line comprises LowSupport alts that were not validated by PET analysis and therefore were not separable from but rather consistent with technical error (red-filled triangles).
In Figure 3C, the IS VAF value was replaced with the LOB value estimated based on PET analysis. As with Figure 3B, the Sample DfIS TP variants (green-filled circles) cluster significantly above the LOB (red-filled triangles). In Figure 3C, some Sample DfIS NT alts appear on the plot that are not present on Figure 3B because, using PET analysis, a LOB can be calculated even for NT alts for which zero alts were observed in IS. In contrast to Sample DfIS (Figures 3B and 3C, upper panels), for Sample EfIS (Figures 3B and 3C, lower panels), separation between TP (circles) and NGS error (triangles) was reduced due to the 5-fold further dilution. Correspondingly, the distribution of PET values for TP variants in Sample EfIS (Figure 3A, lower panel) was closer to that for technical error.

Conclusion
Use of SNAQ-SEQ QC to report variants based on calculation of an LOB, LOD, and significance score for each variant at each targeted nucleotide position in each ctDNA sample is a significant advance compared to current practice in which a predefined VAF LOD is imposed. Mixture of each sample with a synthetic spike-in IS for each targeted region enables direct measurement of NGS technical background errors. No other method provides within-run measurement of background, as is presented here. More accurate technical error measurements enable more accurate mutation detection. In the absence of SNAQ-SEQ QC, they observed poor accuracy for calling variants with VAF <0.5% in ctDNA.
Variant callers based on statistical analysis alone are tuned to a narrow range of coverage and assumption of NGS error rates based on panels of ‘‘normal’’ samples. In contrast, the SNAQ-SEQ QC significance scores based on PET analysis adjust to sample and target-specific coverage and directly tested error rate. Thus, the SNAQ-SEQ method will inform the user when any value cannot be reported with confidence due to low coverage. Importantly, they are able to minimize stochastic sampling effect on IS error detection by ensuring an IS/NT ratio of 2.5 or greater which means, the IS will always be able to estimate the NGS background error for the given sample as long as the minimum NT alt count is observed.
There was no evidence that inclusion of SNAQ-SEQ IS in samples interfered with testing sensitivity or specificity, and has no impact on sample coverage, workflow or performance.
In particular, use of SNAQ-SEQ unique within-run QC enabled determination of technical error, LOB, confidence limits, and calculation of lower LOD for each variant at each nucleotide position in each sample. This represents amajor advance because, due to the limited number of genome copies in ctDNAspecimens, it is critical tomaximize the ability to reliably report low VAF actionable mutations. This approach controls for systematic chemical-physical NGS errors, pipeline-specific non-systematic errors, and coverage. Our work promises to provide a reliable method to increase the yield of reportable variant calls in low input clinical ctDNA samples.
Comments
Post a Comment